
Debug Project: browses for a project file and instruments it for debugging with the plan selected in Options (see below).
Console: opens the VB Watch Console for multiple projects instrumentation.
Show Windows: brings back all the windows that were closed. To display only one window, select it from the drop-down menu.
Remove dead threads: each "living thread" is associated to a tab with a color button. When the thread is terminated for any reason, no more data is displayed in the corresponding windows and the tab button turns to red. Press the Remove dead threads to remove the data and tabs associated to dead threads.Options:
 |
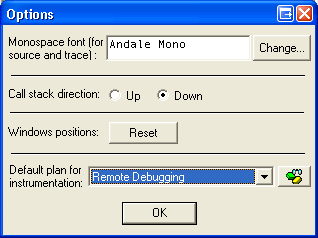
Monospace font: select the font used to display source code in windows. Call Stack direction: select the call stack direction. Reset Windows Positions: click this button to restore all windows back to their initial position. Default plan: select the plan that will be used for instrumentation with the Debug Project button above. Control Center: click the Control Center button to edit plans. |
Always on top: sets the VB Watch Debugger always on top of other windows.
About: displays the Debugger's current version.
Help: brings this help file.
Refresh every ... ms: when this button is not checked, the debugger must refresh the display whenever a new message is received (line execution, procedure call, etc...), which is very slow. By checking this button, you can set a refresh rate from 50 ms (0,05 second) to 3000 ms (3 seconds), which speeds up considerably the whole process.
Speed: displays the number of messages received per second to help you determine the best value for the refresh rate.

Continue (shortcut: F5): this button continues the execution of the debugged application.
Break (shortcut: Break): this button stops the execution of the debugged application.
Next procedure (shortcut: Shift F8): this button continues the execution of the debugged application until the current procedure is exited or a new one is entered.
Next line (shortcut: F8): this button continues the execution of the debugged application until the next line.
Run again: runs a new instance of the exe corresponding to the currently selected thread. To run again the exe of a previously debugged application, select from the drop-down menu.
Kill thread: this button kills the current thread the API way.
Warning:
Whenever possible you should terminate your applications the natural way.
This thread-killer function may leave some processes in memory especially
if you are debugging a group of projects at same time. You will still be able
to detect and kill those left processes from the Windows Task Manager (CTRL+ALT+DEL).
Auto-break On/Off: this button enables or disables auto-breaking an application according to the Auto-break filters.
Auto-break filters: allows to select the Auto-break filters.
Status bar: in break mode, displays the current breakpoint and the application being breaked.